California is experiencing a severe drought. Governor Brown proclaimed a State of Emergency to manage and conserve our freshwater supply [1]. The detrimental impacts of the drought include an increased frequency and severity of forest fires [2], disrupted ecosystems [3], diminished drinking water quality [4], and a suffering economy. As the largest component of the latter, consider that agriculture in California raked in $54 billion in 2014 [5]. These farms need water to grow their crops; less rainfall combined with scarce and consequently expensive freshwater drive up the price to produce a given crop. This results in rising food prices for consumers — even outside of California.
California’s agricultural abundance includes more than 400 commodities. The state produces nearly half of US-grown fruits, nuts and vegetables. Across the nation, US consumers regularly purchase several crops produced solely in California.
- California Department of Food and Agriculture [5]
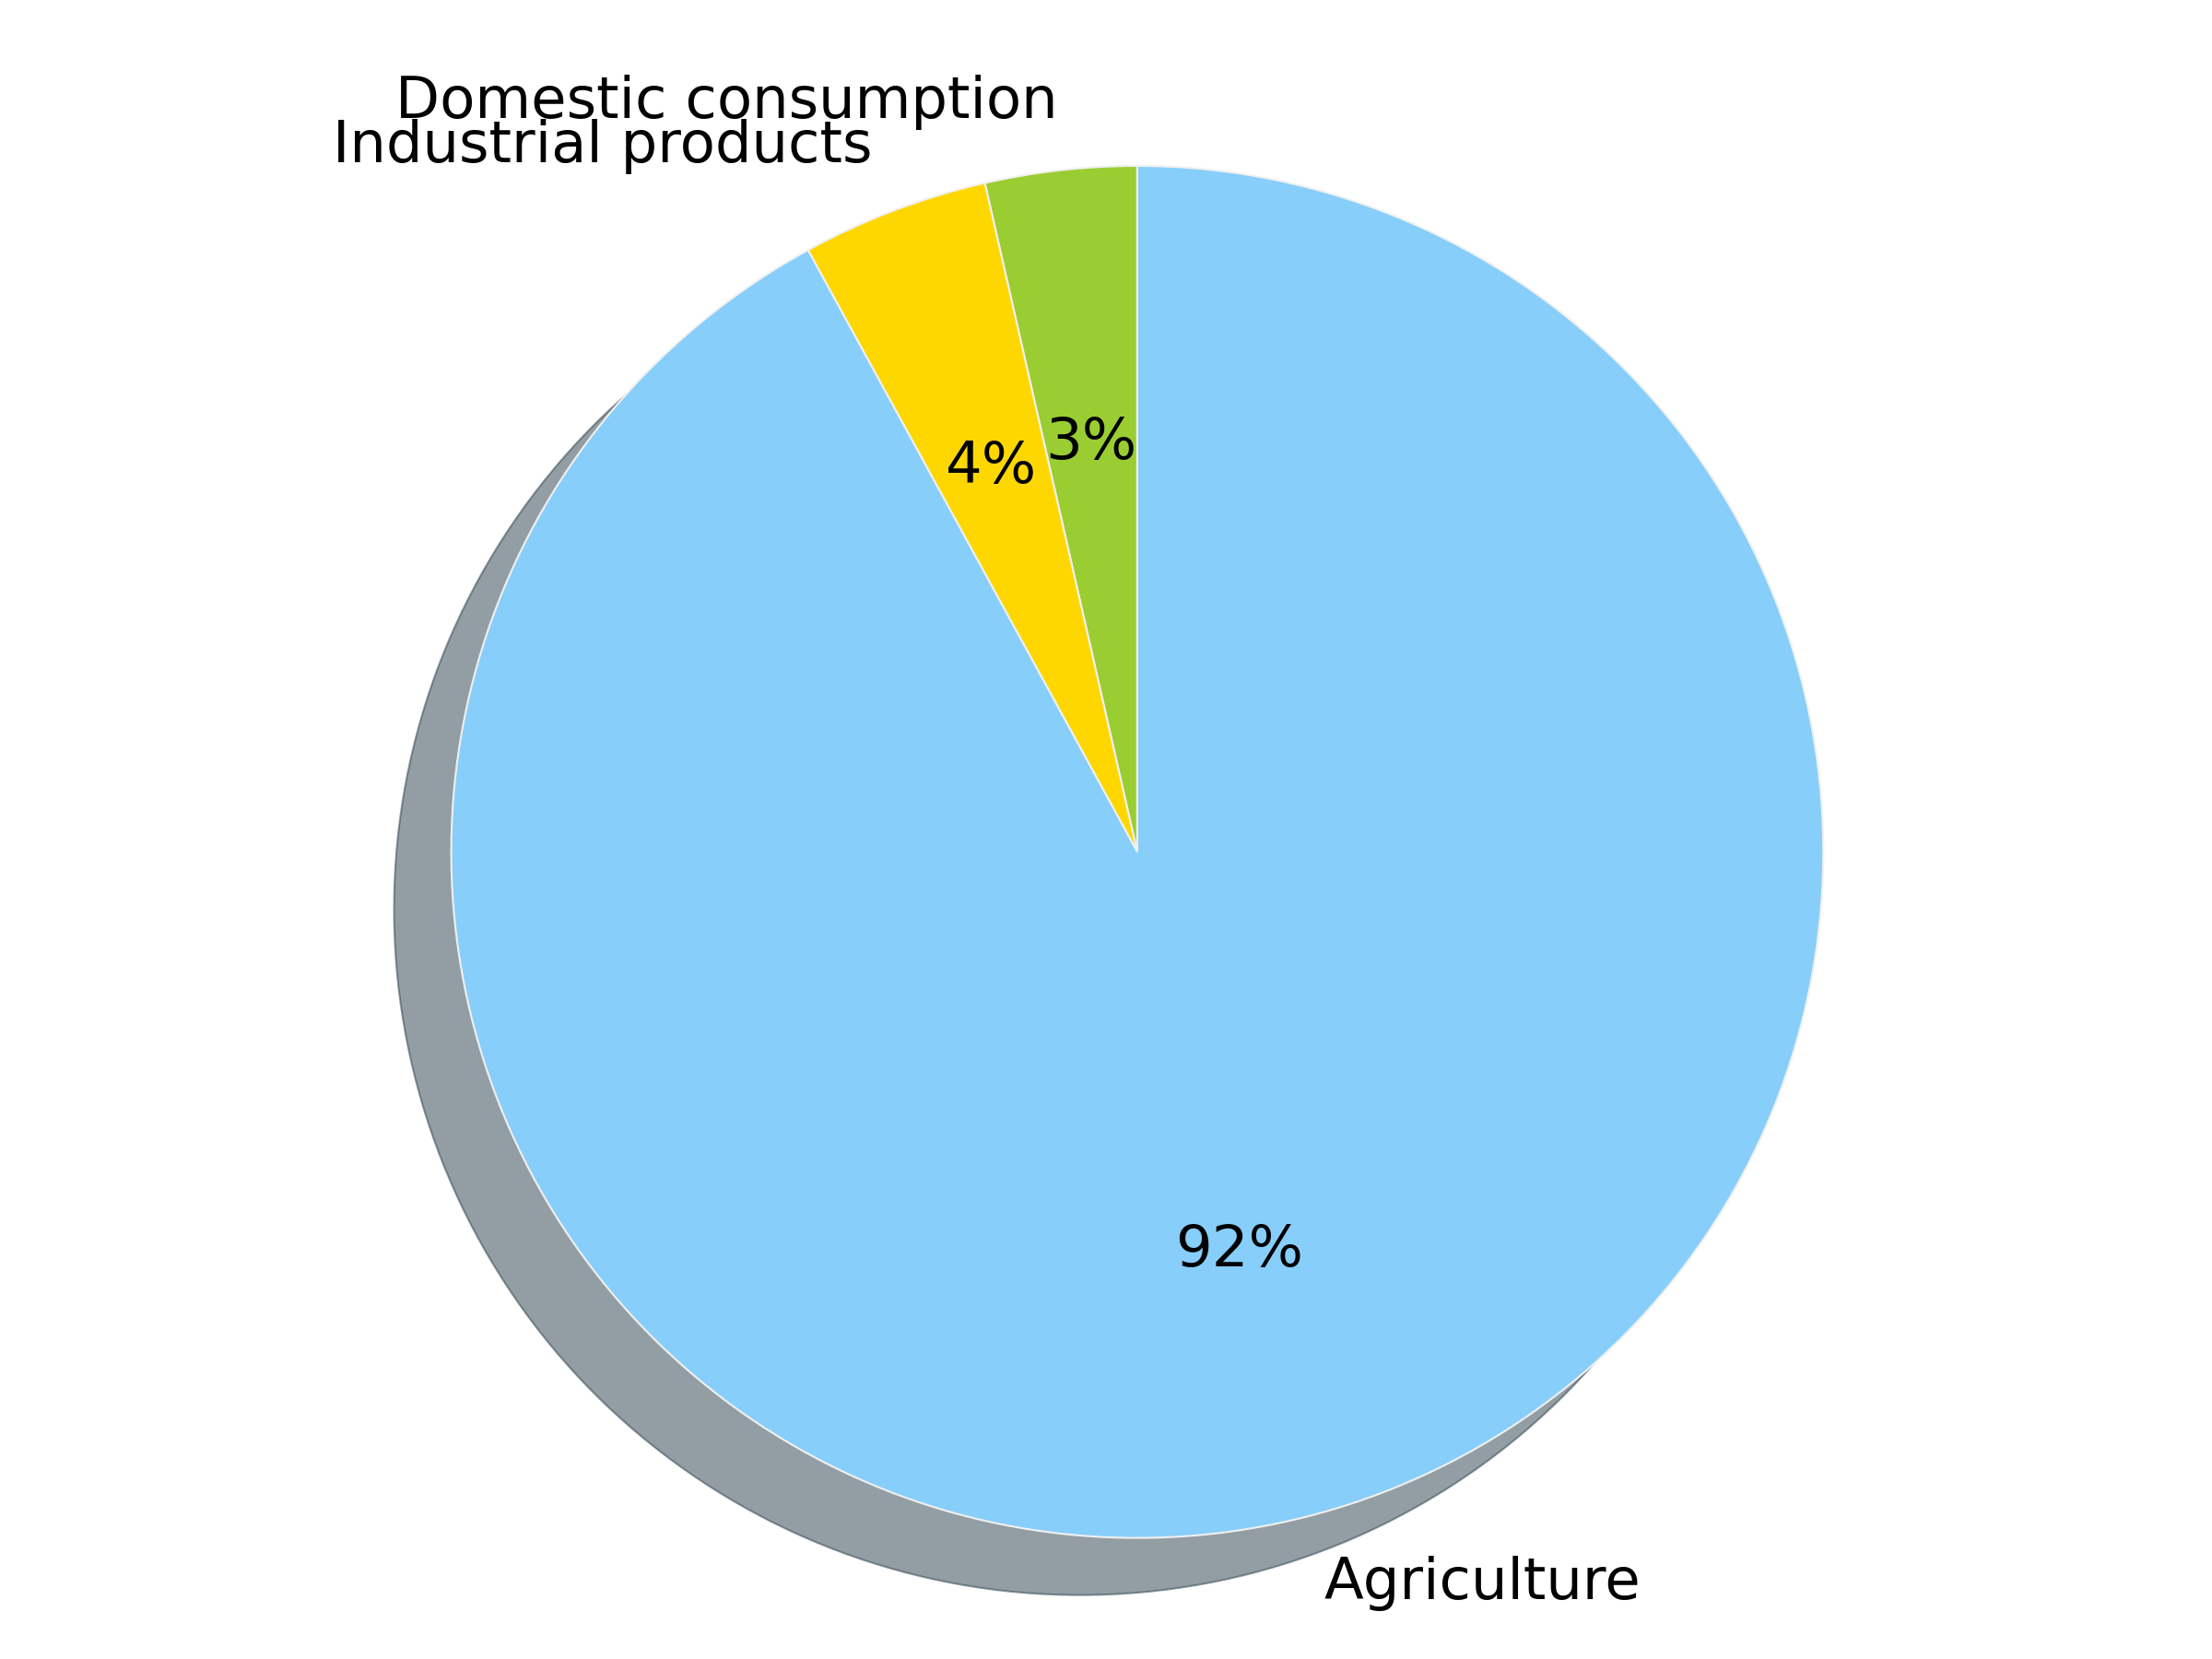
It is thus imperative to conserve freshwater. The average person in the US incurs a water footprint of 2,000 gallons of water per day [6]. This number seems incredulously large at first thought. Given the flow rate of a typical shower head, 2.5 gallons per minute, this amounts to taking a ~14 hour shower daily. But, if we fixate on the water that we lucidly see flowing in our homes — through our sink, toilet, and shower— we only consider a small fraction of our individual water footprint (3%). By far, the largest share of our water footprint implicitly comes from the food that we eat. “Virtual water.” Much of this food is grown in drought-stricken California.
Following our discussion about the economic impact of the drought on agriculture, in hindsight, it is not surprising that most of our water footprint comes from the food that we eat. Collectively, as consumers, our demand for food drives the demand of the agricultural sector for water.
The pie chart above shows that, as individual consumers, if we want to take the most significant measure to reduce our water footprint, we should focus less on how long we spend in the shower and more on the food that we eat. The easiest and most impactful effort to conserve water is to refrain from wasting food.
The next effort we can make to conserve water is in our choice of foods that we eat. Different foods incur different water footprints. This product gallery compares how much water is required to produce different foods and drinks. Note the trend that meat generally requires much more water than fruits, vegetables, and grains. By far one of the most water-intensive foods is beef, requiring 1,850 gallons of water per pound. Beef incurs such a large water footprint because we have to grow the feed for the cow and give it water to drink for its lifetime; raising a cow is a very inefficient process to put calories on our plate compared to e.g. directly eating the corn and soybeans that we feed the cow. Generally, following this reasoning, eating less meat can significantly reduce our water footprint.
On a mass basis, chicken is more water-efficient than beef by a factor of 3.5. Consider substituting chicken for beef.
Of course, many factors together determine the water footprint of a given food, leading to large variations in the water footprint of a given food, e.g. depending on the region in which the crop is grown. Furthermore, growing crops in a region with a large amount of natural rainfall reduces required irrigation from rivers, lakes, and reservoirs. Unfortunately, much of our nation’s crops are grown in drought-stricken California.
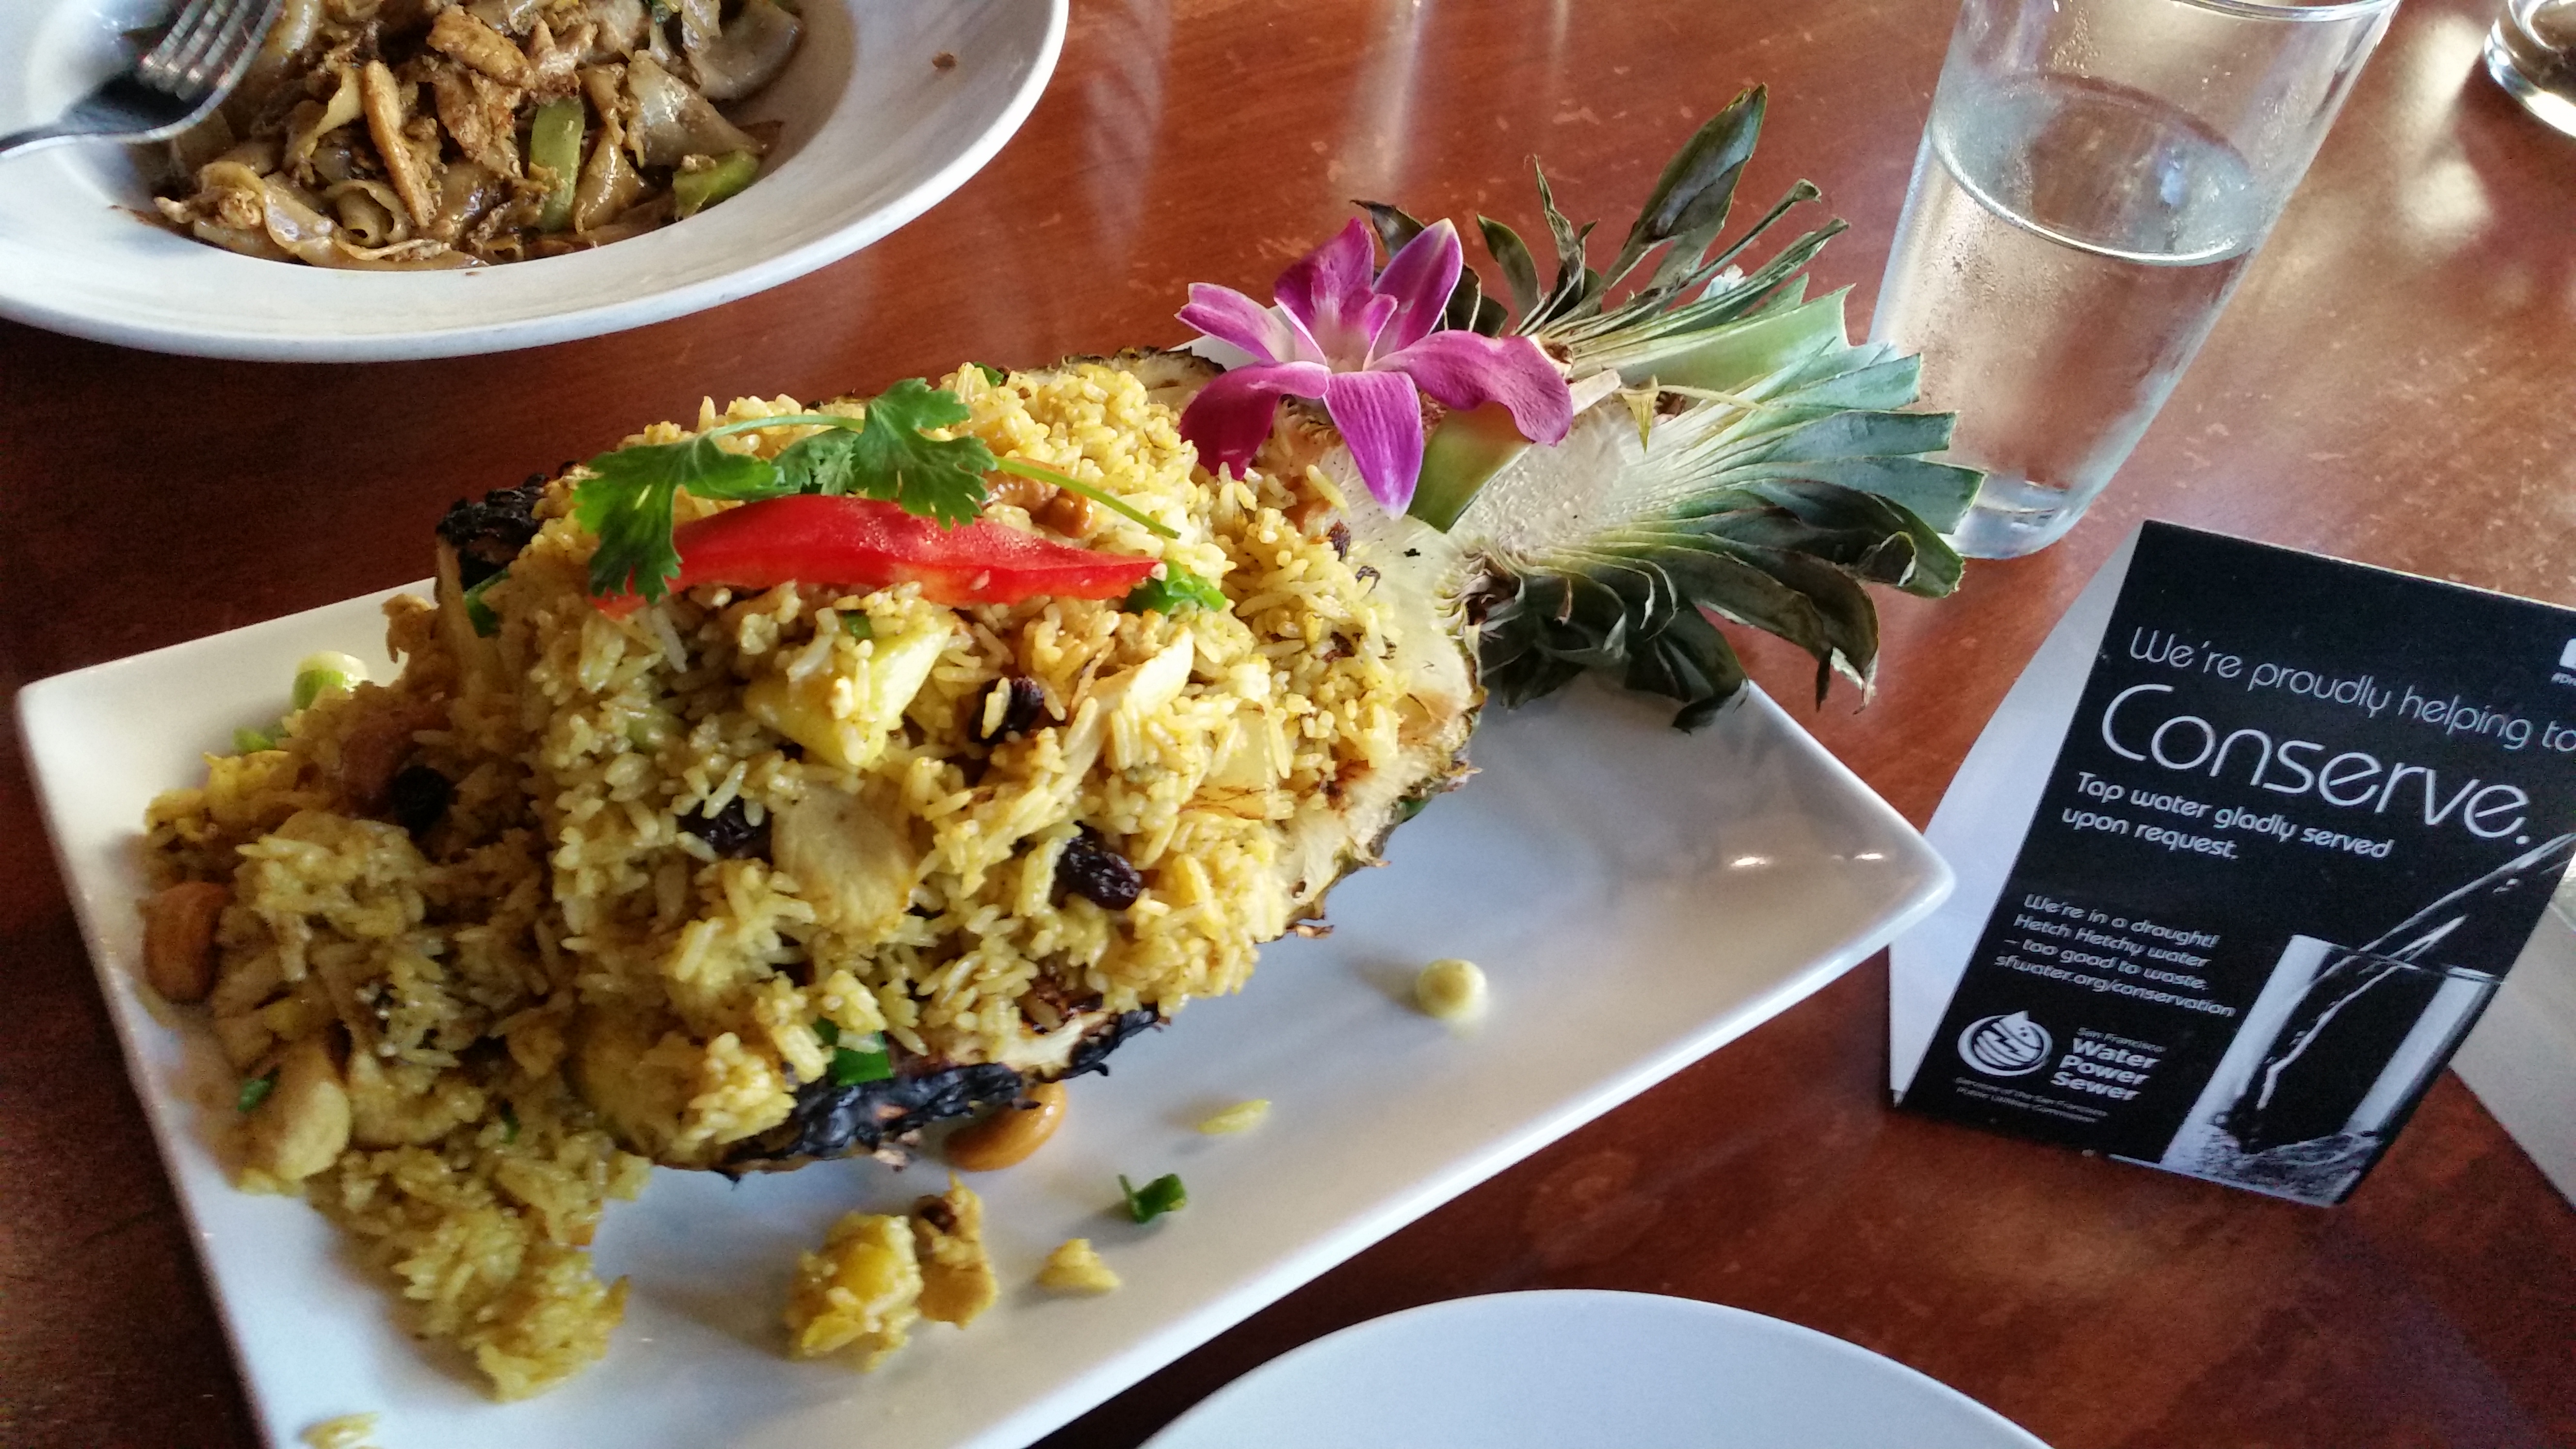
My motivation for writing this article came while eating at a Thai restaurant in San Francisco. Instead of automatically refilling my empty glass of water, a card on the table (see cover image) encourages water refills only by request. Albeit an admirable intention, this will have a much less significant impact on our water footprint than if the focus were on the food beside the glass of water. Instead, I suggest a sign that reads:
- Save your leftover food for tomorrow’s lunch instead of throwing it in the trash.1
- Try omitting meat.
- Consider substituting chicken for beef.
The above are my conclusions.
Finally, I must editorialize that unnecessary water use, such as watering urban lawns, is irking. Brown is the new green!
An engaging, interactive visualization of our water footprint: here.
More data visualizations regarding water footprints of food and drinks are on my blog, but the above is better.
A detail: note in the product gallery that we can distinguish between green water, blue water, and gray water in the water footprint of a given product. See a description on Wikipedia here.
1 I imagine that the production of the disposable plastic container that you use to take your food home consumes less water than to grow/produce your leftover food.
References
[2] (a) http://www.nytimes.com/interactive/2015/07/15/us/california-fire-season-drought.html?_r=0; (b) Dale, V. H., Joyce, L. A., McNulty, S., Neilson, R. P., Ayres, M. P., Flannigan, M. D., … & Michael Wotton, B. (2001). Climate change and forest disturbances: climate change can affect forests by altering the frequency, intensity, duration, and timing of fire, drought, introduced species, insect and pathogen outbreaks, hurricanes, windstorms, ice storms, or landslides. BioScience, 51(9), 723–734.
[3] http://www.nature.com/news/native-ecosystems-blitzed-by-drought-1.15707
[4] Centers for Disease Control and Prevention. http://www.cdc.gov/features/drought/; My personal testimony in Berkeley: http://www.berkeleyside.com/2015/03/30/berkeley-residents-complain-about-horrible-water-taste/
[5] California Department of Food and Agriculture. https://www.cdfa.ca.gov/statistics/
[6] Hoekstra, A. Y., & Mekonnen, M. M. (2012). The water footprint of humanity.Proceedings of the national academy of sciences, 109(9), 3232–3237.
comments powered by Disqus