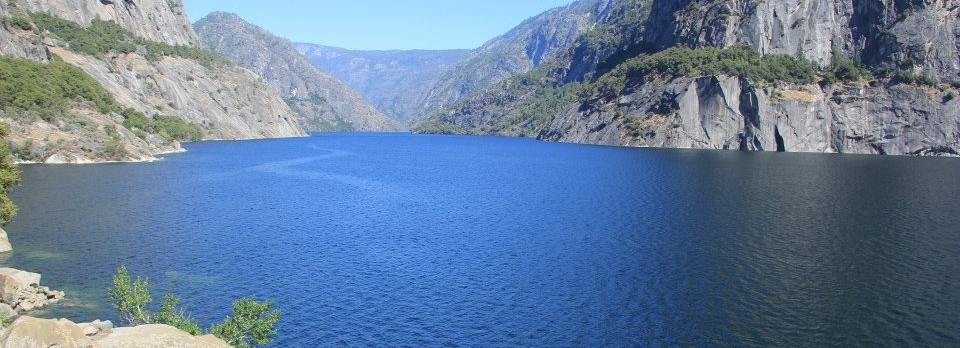
In the US, water is thought of as a cheap and abundant resource. The current drought in California has challenged this mindset and reminded us that a relatively local supply of water is imperative to sustain a prosperous economy. In the face of climate change, natural variations in weather, and a growing population, everyone needs to be more cognizant about our water supply and use.
The average person in the US uses 2,057 gallons of fresh water per day. Given the flow rate of a typical shower head, 2.5 gallons per minute, this amounts to taking a ~14 hour shower!
However, we do not see most of the water that we consume each day flowing through the pipes in our homes. Below is a Sankey diagram showing the breakdown of our water use. Domestic consumption – the water we use to shower, flush the toilet, cook, do laundry, etc. – accounts for only 4% of our water use. We also implicitly use water when we, for example, use a paper cup, since it took water to produce it. The water used to produce the industrial products that we use accounts for 12% of our water footprint. The rest, and by far the largest fraction, is from agriculture.
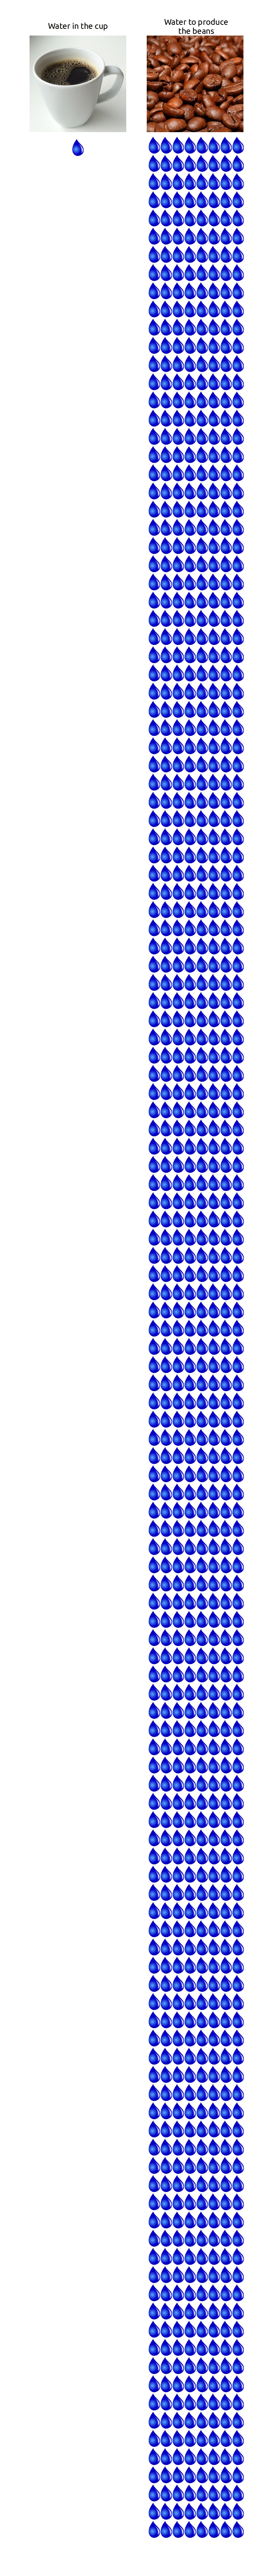
Consider the question “How much water does it take to make 1 cup of coffee?”. The graphic below shows that the water that you see in the cup of coffee is only a small fraction of the water used to grow, process, and transport the coffee beans. Get ready to scroll! Each drop represents 1 cup of water.
Thus, for water conservation efforts, we should think less about shortening our shower and more about the food that we waste and the type of foods that we choose to eat. Some foods take more water to produce than others. The bar chart below shows much water it takes to produce different foods on a mass basis. Eating meat invokes the largest water footprint. Water is needed to grow the crops to feed the farm animals, which is inefficient since we could use this water to grow crops that we can eat directly. Further, we need to give the animals water to drink and wash them.
In summary, most of the water that we consume day-to-day, we do not see. It is hidden in the food that we eat and industrial products that we use. Different foods take different amounts of water to produce. Meat has the largest water footprint.
The data in the Sankey diagram is from: Mekonnen, M.M. and Hoekstra, A.Y. (2011) National water footprint accounts: The green, blue and grey water footprint of production and consumption, Value of Water Research Report Series No. 50, UNESCO-IHE, Delft, the Netherlands.
The data in the bar plot is from: Mekonnen, M.M. and Hoekstra, A.Y. (2011) The green, blue and grey water footprint of crops and derived crop products, Hydrology and Earth System Sciences, 15(5): 1577-1600.
An interactive gallery of the water footprint of different products and more information can be found at waterfootprint.org.
comments powered by Disqus