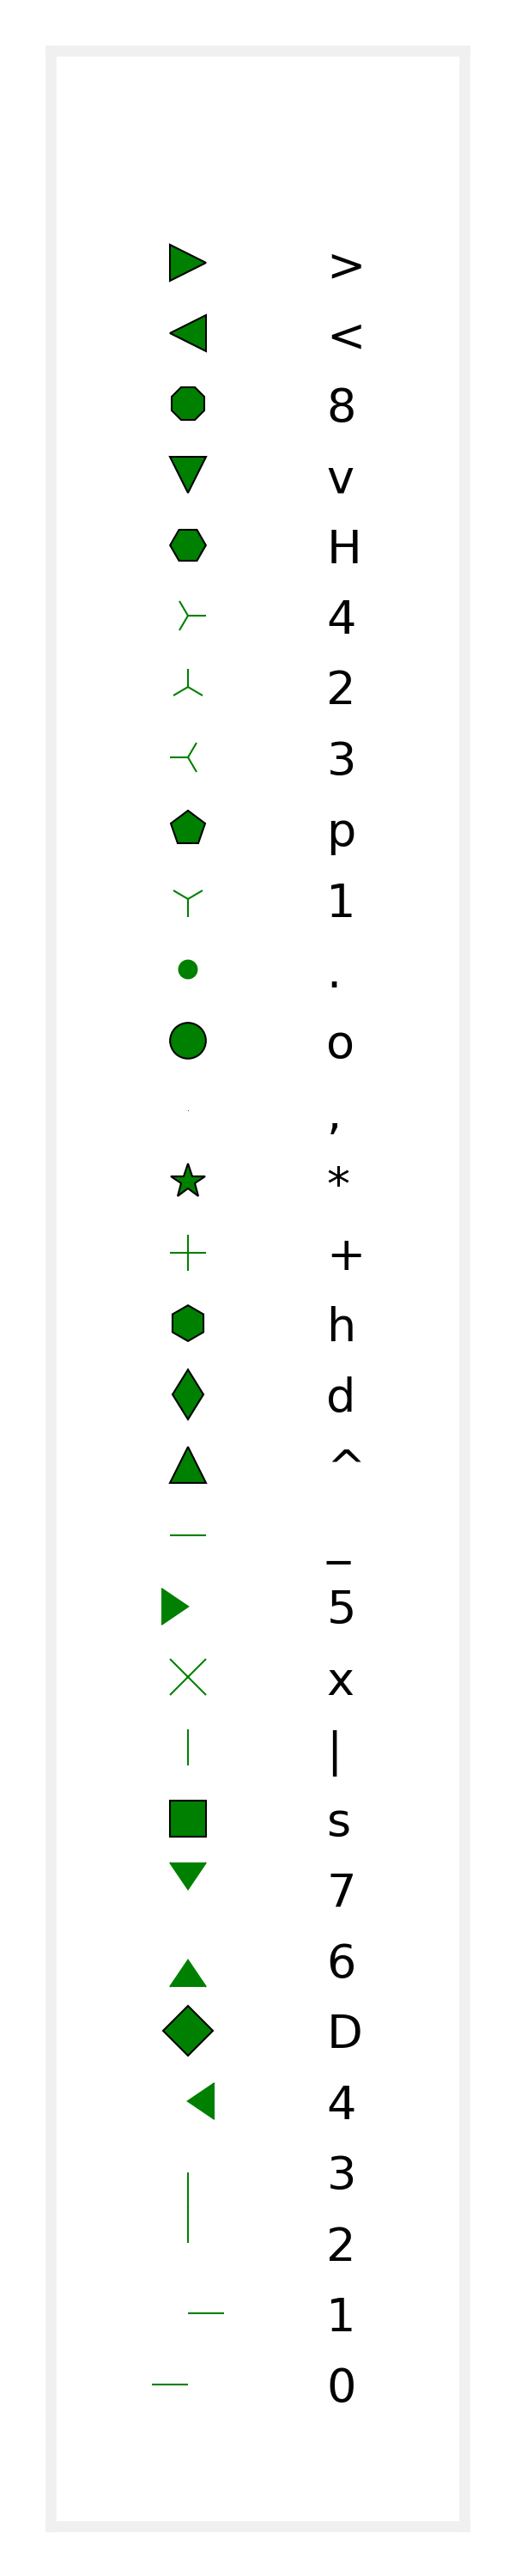
The description of possible markers on the Matplotlib description here does not show what each marker looks like, so I made the visualization below to aid in choosing a marker for scatter plots. The left column displays the marker; the right column shows the corresponding marker label in Matplotlib.
e.g. the code below will use square markers.
import matplotlib.pyplot

plt.plot(x, y, marker='s')