
Inequality in America is on the rise. Wealth is concentrated in the pockets of the richest portion of our population, and the rich are getting richer. For example, the bottom 90% of America received only 49.6%– less than half– of the pre-tax income [1].
Of the developed countries in the world, the United States has the most unequal incomes, after adjusting for income redistribution from our tax system. [2] Economists often characterize the inequality of income or wealth of a nation by the Gini coefficient, which is a number between 0 and 1. In this post, we will discuss how one computes the Gini coefficient from income data.
The statement that the bottom 90% of Americans received only 49.6% of the income is striking, but it is a somewhat arbitrary measure of inequality; why not look at the bottom 95% or 99.9%? To properly compare different countries, we should consider all such statements:
The bottom \(x\)% of Americans received \(y\)% of the income.
-- The Lorenz curve
This is precisely the information that the Lorenz curve contains, which is a plot of the cumulative fraction of the income, \(y\)%, that is received by the bottom (the lowest-earners) \(x\)% of the population.
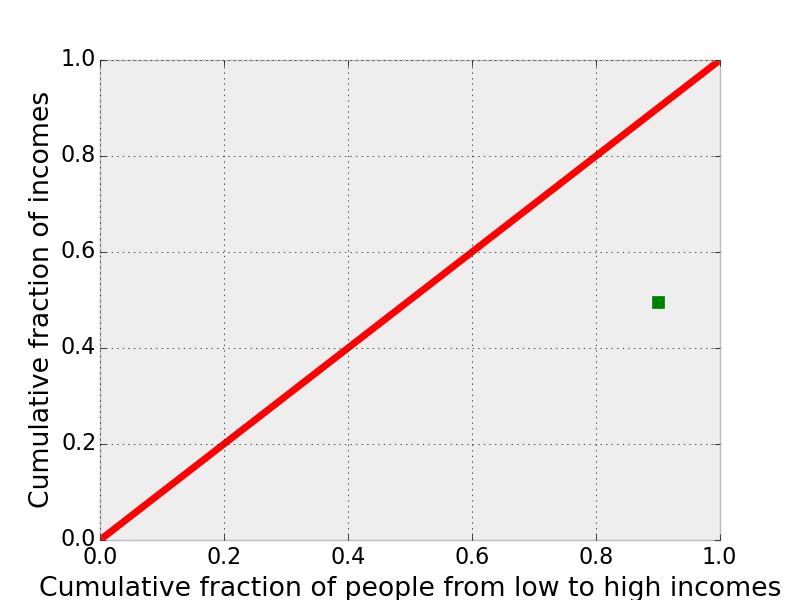
In a completely equal society, the bottom \(x\)% of the population would receive \(x\)% of the income, and the Lorenz curve would be a straight line with slope 1, the red line in the plot below. I plotted the single point on the Lorenz curve that we know for the US from the statistic that the bottom 90% received 49.6% of the income. To visualize the inequality in America, take note of the distance of this point from the red line of a perfectly equal nation. We will see that the Gini coefficient will involve some notion of a distance of the Lorenz curve from the red line of equality.
So how can we build the Lorenz curve, given that we have a list of incomes? As an example, consider a unit in a hospital that pays its employees a total of $500K/yr to its employees. The first step is to order the employees from the lowest to highest income, so we can easily look at the bottom fraction of the incomes.
| Employee | Income |
|---|---|
| Janitor | $30 |
| Receptionist | $40 |
| Nurse | $80 |
| Doctor | $150 |
| Surgeon | $200 |
To compute the Lorenz curve for this hospital unit, we need to append two more columns. In the first, I wrote the fraction of the employees that have salaries lower than or equal to this employee (including this employee) as we run down the list. In the second, I added up the incomes of all people that are included in this bottom fraction, the cumulative income. As a check, the last entry in this column is $500K, the total amount of income the hospital unit is paying to its employees.
| Employee | Income | Cumulative fraction | Cumulative income |
|---|---|---|---|
| Janitor | $30 | 1/5 | $30 |
| Receptionist | $40 | 2/5 | $70 |
| Nurse | $80 | 3/5 | $150 |
| Doctor | $150 | 4/5 | $300 |
| Surgeon | $200 | 5/5 | $500 |
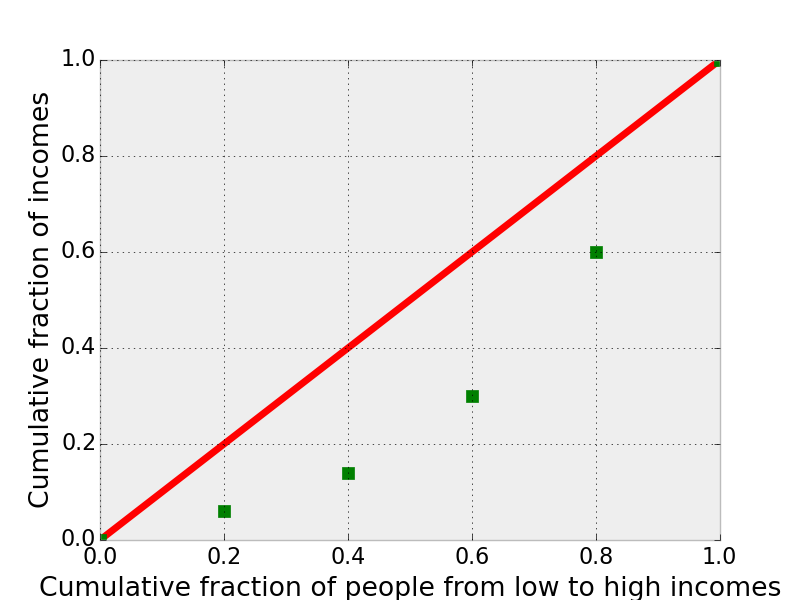
The Lorenz curve for this hospital unit is a plot of the cumulative income column divided by $500 against the cumulative fraction of employees, shown as green squares below. We also have a point at (0,0) since, of course, the bottom 0% of people get 0% of the income. The Lorenz curve shows the entire picture of statements such as “the bottom \(x\)% earn \(y\)% of total income”. Again, I plot the red line of a perfectly equal hospital unit. The “gap” between the red line and the blue line is a measure of inequality in the incomes in the hospital unit.
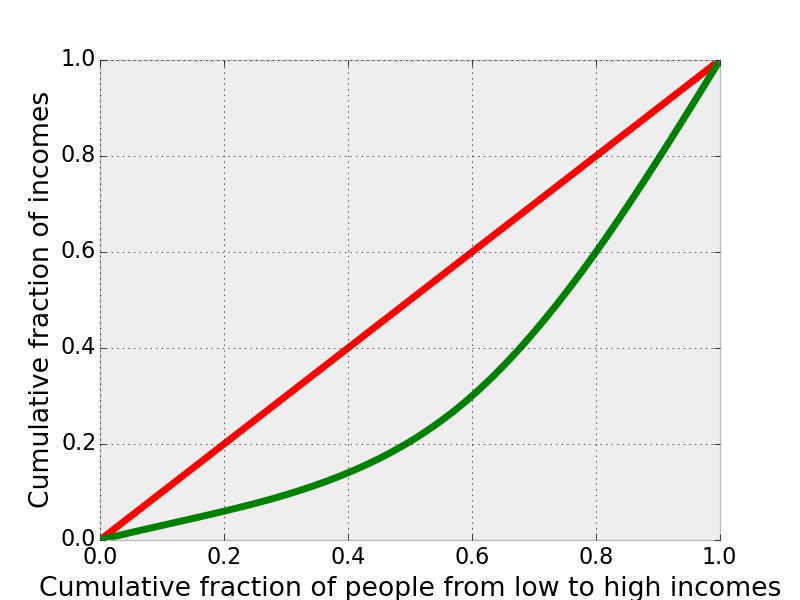
We can imagine that, if we have a sorted list of incomes from every working person in the United States, the points on the Lorenz curve that I plotted above will look like a continuous line.
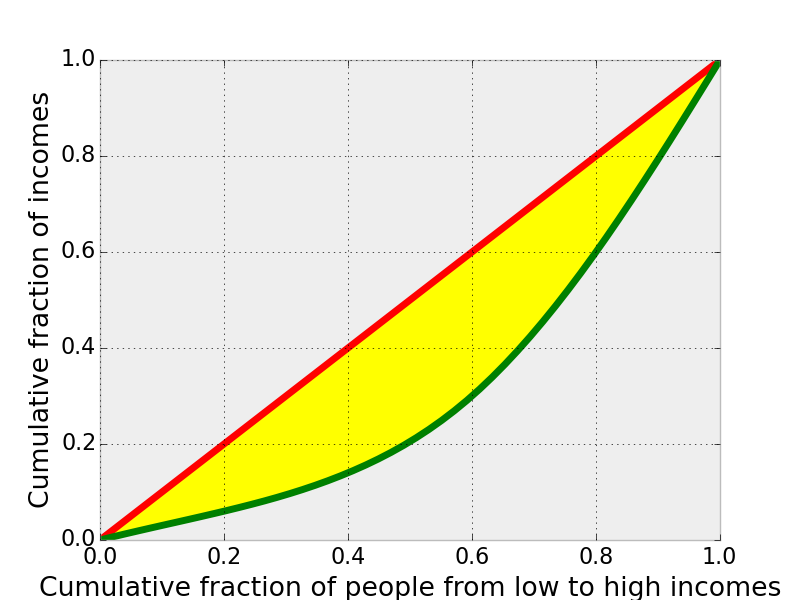
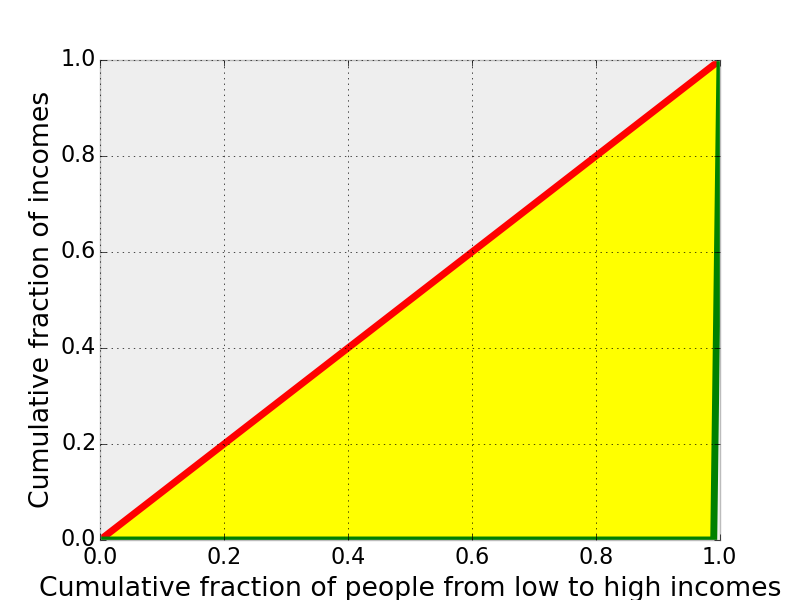
The Gini coefficient is related to, intuitively, the area between the Lorenz curve and the red line of perfect equality, the region highlighted in yellow below, since this can be thought of as the deviation from an equal society.
As the Lorenz curve begins to hug the red line of equality, this area shrinks to zero. So, a Gini coefficient of 0 implies a perfectly equal society. In a completely unequal society, where, say one person has all of the wealth and the rest have zero, the Lorenz curve would look like the following:
In this other extreme, the area between the Lorenz curve and the line of equality is that of the bottom triangle in the graph, 1/2. Thus, to make the Gini coefficient range from 0 in a completely equal society to 1 in a completely unequal society, we define the Gini coefficient as twice the area between the Lorenz curve and the line of equality.
This page on Wikipedia has the Gini coefficient of wealth for a list of countries. If we order ascending by the wealth Gini, take note that the United States is at the bottom of the list with one of the largest Gini coefficients. In other words, the yellow area for the Lorenz curve of the United States is larger than most other countries.
As for the economic and social implications of the inequality in the US, I highly recommend watching the entertaining and informative documentary Inequality for All, which is on Netflix.
[1] http://www.pewresearch.org/fact-tank/2014/01/07/5-facts-about-economic-inequality/
[2] http://www.newyorker.com/rational-irrationality/american-inequality-in-six-charts
comments powered by Disqus